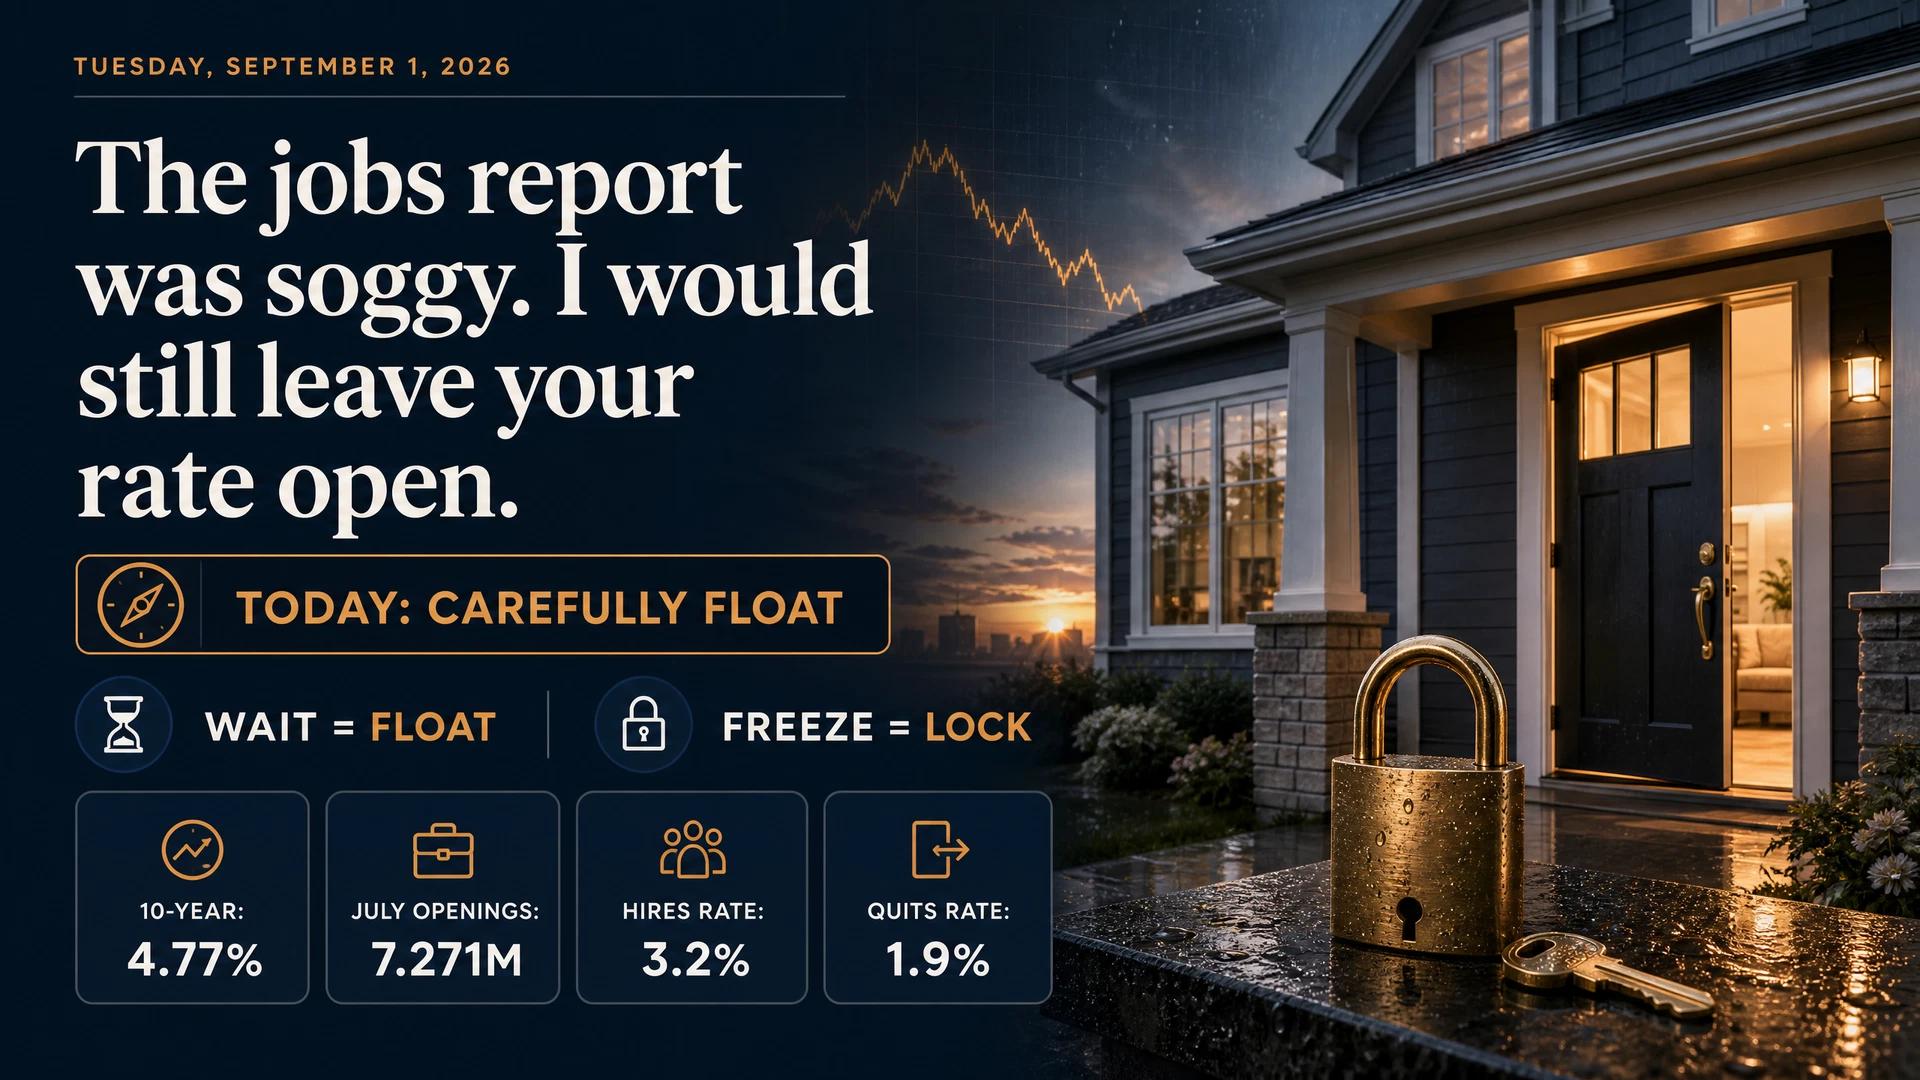
This morning’s JOLTS report was soft enough for me to leave a rate open at the start of the day. That is a float.
Freezing the rate is a lock. Carefully floating means you wait, but you keep watching the market and the payment.
I would not confuse a soft jobs report with a rate sale. A later September 1 market update had the 10-year Treasury yield at 4.77% after it reached 4.798% earlier in the session. Oil was higher, and traders still leaned toward a September rate hike.
My call is to carefully float, not wander off.
What did the jobs report actually say?
The Labor Department’s JOLTS report counts job openings, hires, quits, layoffs, and other ways workers move through the labor market.
July job openings rose by 89,000 to 7.271 million. That sounds stronger until you see the revision. June was cut by 177,000, from 7.359 million to 7.182 million.
The July result also missed the 7.300 million forecast by 29,000.
Hiring was weaker. It fell by 278,000 to 5.054 million. The hires rate dropped from 3.4% to 3.2%.
The quits rate moved down to 1.9%. People are not leaving jobs as freely as they do when employers are fighting over workers.
I left out the claims about fake openings and remote jobs being counted in several states. The official report did not support them. The cleaner warning is that the JOLTS survey response rate has fallen to just above 30%, down from around 58% before the pandemic.
Why did the rate market stay stubborn?
A soft labor report did not erase the other pressure in the market.
The 10-year Treasury reached 4.798% before pulling back to 4.77% in the later report. That intraday high was the highest since January 14, 2025.
A basis point is 0.01 percentage point. One hundred basis points equal one percentage point.
The 10-year Treasury is not your mortgage rate. Mortgage rates often move in the same direction, but mortgage-backed securities, lender pricing, loan details, and market conditions still decide your actual offer.
That is why a weak opening number did not hand buyers a cheaper payment.
What did the mortgage-bond chart show?
The chart below is the market snapshot supplied with this update. It showed the 30-year 6% mortgage-backed security coupon at 101.02, down 7 basis points at capture.
The marked levels were 101.38, 101.18, 101.02, and 100.95. The market was testing the lower part of that range.
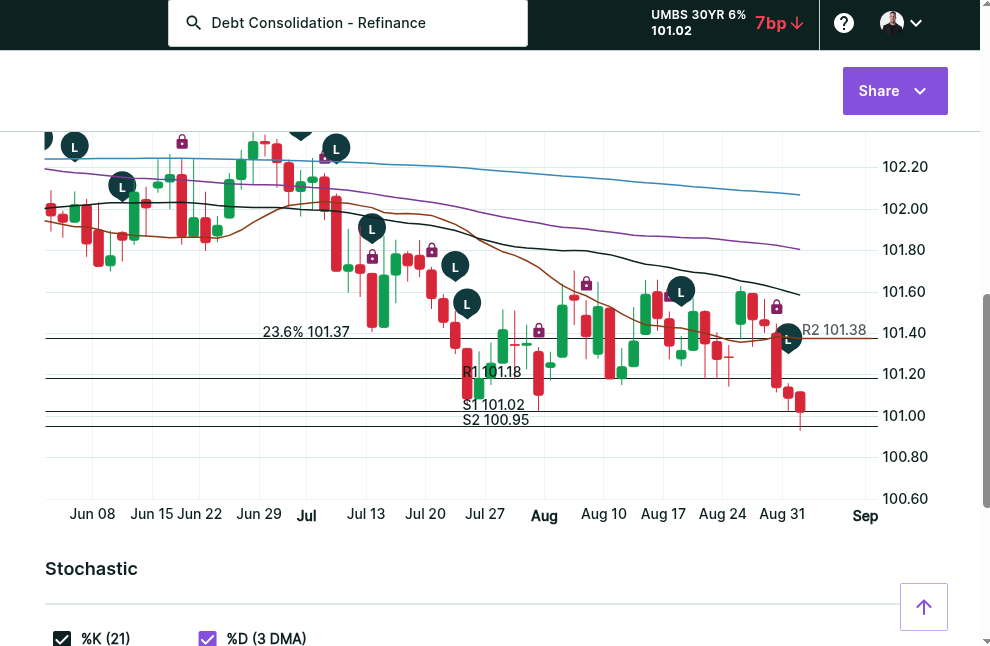
Those lines can help describe where trading paused. They do not promise the market will bounce or break.
What else was pushing yields higher?
Oil was still part of the problem.
A later market update had U.S. crude up 2.8% at $88.16 per barrel and Brent up 2.32% at $92.59. Reports said two tankers came under fire while leaving the Strait of Hormuz.
Higher energy costs can feed inflation pressure. That can keep bond yields and borrowing costs higher.
The government-bond selloff was not just an American story. Japan’s 10-year yield reached 3% for the first time since 1996. British 30-year borrowing costs reached 30-year highs. German and French 10-year yields were at levels last seen in 2011 and 2008.
That is more accurate than saying every global bond yield was at a 20-year high.
What did the Fed say?
Federal Reserve Governor Michael Barr said the Fed should raise rates if inflation does not moderate enough. He also said officials could take more time if the data showed inflation moving toward 2%.
That was a conditional statement. It was not a scheduled rate hike.
Near the JOLTS release, futures put the chance of a September hike at roughly 66%. Later pricing moved to 68%.
Those odds move during the day. They tell you what traders were pricing at that moment, not what the Fed has promised to do.
What comes next?
ADP releases its August private-employment report Wednesday at 8:15 a.m. Eastern.
The official August jobs report arrives Friday at 8:30 a.m. Eastern. A later poll expected 56,000 jobs. That estimate had moved as new survey responses arrived.
The July report showed payrolls fell by 23,000 and unemployment was 4.1%.
A weaker Friday report could pull rate expectations down. A stronger report could push the other way. Neither outcome is guaranteed.
What I would do today
I would start by carefully floating if the file has enough room and the payment is not already at the edge.
Then I would watch four things.
- How soon you close.
- How much payment change you can tolerate.
- How long the available lock lasts.
- Whether the lender offers a float-down if pricing improves later.
If you are close to closing, your payment is already tight, or the lock window is getting short, waiting may not be worth the risk.
The Consumer Financial Protection Bureau’s rate-lock guide explains that lock terms, extension costs, and what happens if the application changes can vary.
Yesterday’s setup is in Rates Got Uglier Overnight. I Would Freeze Yours. The call changed today because the data changed. That is the point of a daily market update.
If you are still shopping
Do not build your budget from last week’s quote. Run the payment again when you are ready to make an offer.
Use Why the Maximum Approval Is the Worst Number to Base Your Home Purchase On to separate what underwriting allows from what your household can live with.
Want me to check the file?
If you are 30 to 45 days from closing, send me the scenario. I want to see the current payment, closing date, lock period, extension policy, float-down terms, and how much movement you can tolerate.
If you are still looking, start the soft-check mortgage application. Then we can review the payment on a Pre-Purchase Zoom before you make an offer.
Follow Ratewatch Daily for the next sourced market update.
Sources and limitations
- Bureau of Labor Statistics: July 2026 Job Openings and Labor Turnover Survey.
- Reuters: U.S. job openings rise after a sharp June revision.
- Reuters: September 1 Treasury yields, oil prices, Fed futures, and jobs consensus.
- Reuters: Michael Barr’s conditional September rate comments.
- Reuters: September 1 oil move and Strait of Hormuz shipping risks.
- Reuters: Multi-decade peaks in global government borrowing costs.
- Federal Reserve: 2026 FOMC meeting calendar.
- ADP: September 2 report release date and time.
- Bureau of Labor Statistics: July 2026 Employment Situation.
Treasury yields, oil prices, mortgage pricing, and futures probabilities change during the day. The figures above are September 1, 2026 snapshots from the cited times. The hero shows Treasury and labor-market figures, not a consumer mortgage rate. This article is dated market commentary, not a personal rate quote, an offer to lend, or a promise that floating will produce a better outcome. Lock and float-down terms vary by lender and loan.